Cannabinoids, Cannabis, and Marijuana: What is the difference?
Wait, they are not the same? No, they are not, but it really is not that simple. They are somewhat “parts of each other”, which makes it easy for people to misuse the terms. Over the years our understanding have shifted from just referring to these terms in the context of street drugs, to thinking more about its use in medical and recreational settings. There has also been some confusion indicated in class discussions, which is something I will try and tackle in this post to provide a clear explanation.
What is Cannabis?
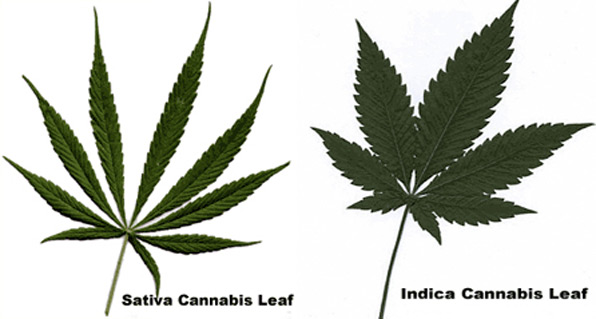
The word itself is used as an umbrella-term to describe all products that have been derived from the Cannabis Sativa plant. The products have a wide variety of uses, as they contain a range of chemical substances from the total of over 500 that make up the plant.
Take a look when compared to another cannabis plant, Cannabis Indica!
What is Marijuana?
Marijuana directly refers to cannabis products (again, from the plant) that contain high amounts of THC. THC, or tetrahydrocannabinol, is the psychoactive “ingredient” of the product itself. It usually presents as dried, shredded leaves and flowers. It is a schedule I drug in the United states.
What is a Cannabinoid?
Cannabinoids are found in cannabis (the plant), and make up a specific group of substances. These include, but are not limited to the above-mentioned THC, and the well-known CBD, or cannabidiol. Cannabinoids are hugely important and hot topic these days, both for their potential in treatment and the controversy they cause.
Medicinal uses of each:
The NIH states that the cannabis plant and marijuana have NOT received approval from the FDA at all, hence why it is still categorized as a schedule I drug. What we call “medical marijuana”, that is approved for medical use, is really just a few medications that contain individual cannabinoids. Two different kinds of medications that we all refer to when using the term “medical marijuana” are Epidiolex and Marinol/Syndros. Epidiolex is used in seizure disorders, and contains purified CBD. Marinol and Syndros are used treat symptoms of cancer, chemotherapy, and HIV/AIDS. These two medications both contain purified dronabinol, which is a form of synthetic THC. Furthermore, according to recent studies, such as this one from 2019, cannabinoids are not only capable treating the symptoms of cancer and chemotherapy, but they may even have antitumor effects. This would mean that substances derived from the cannabis plant could be used to directly treat cancer itself.
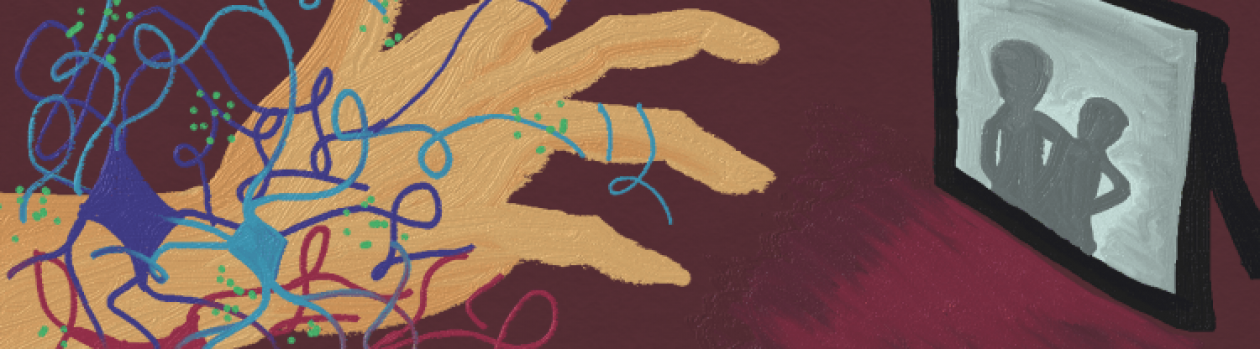
Neuroscience of Cannabinoids
When we talk about chemicals in the brain, we usually pair them with certain receptors that they bind to in order to function and pass on the message they bring. Receptors associated with cannabinoids are called CB1 and CB2 receptors, both of which are found in our bodies. Endocannabinoids function to reduce the amount of cAMP, and they do this by inhibiting adenylyl cyclase, and important participant in many signaling pathways. It is important to note, that these receptors are found on the presynaptic neuron in our brains.
Sources:
https://www.nccih.nih.gov/health/cannabis-marijuana-and-cannabinoids-what-you-need-to-know
https://www.ncbi.nlm.nih.gov/pmc/articles/PMC6387667/
How to Improve Your Quality of Sleep
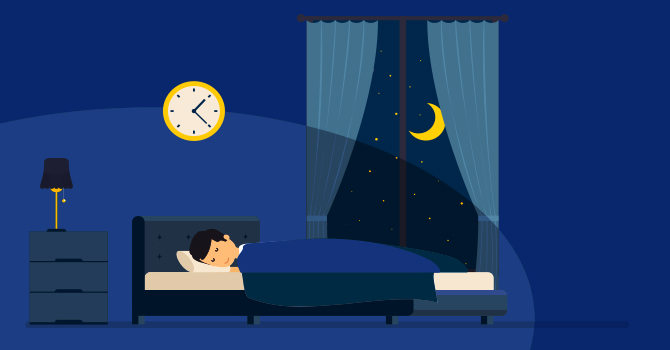
There are many actions that can be taken to improve one’s quality of sleep. Many people have trouble sleeping, staying asleep, or have a sleep disorder. One should always consult their physician if they are experiencing suspected symptoms of a sleep disorder. There are things that can be done to improve your sleep even if you do not struggle with it. People often do not realize that they are not getting the proper amount or quality of sleep. This video provides a great overview of some tips that can be utilized to improve sleep quality.
Keep your sleep schedule consistent
Sleep is of the best quality when someone goes to bed and wakes at the same time each day. Consistency can aid with long-term sleep quality. Irregular sleep patterns affect the function of your circadian rhythm and melatonin release in the brain. Going to bed at different times each night does not allow your brain to properly wind down for the night. A great way to improve sleep quality is to keep your sleep schedule consistent to allow for regulated circadian rhythm patterns and levels of melatonin. The natural hormone cycles of the body can be regulated when someone keeps their sleep schedule consistent.
Set the environment
Every person varies in their natural body temperature and when they feel most comfortable. The ideal bedroom temperature for sleeping ranges from 60-71.6℉. It is important to sleep in an environment that does not feel hot, as this can disrupt sleep. Studies suggest that a hot room can disrupt your body’s natural melatonin release at night. A warm room can also cause someone to wake up more throughout the night and disrupt REM sleep. Other factors are important when creating a restful environment. Outside noises should be reduced as much as possible. A noisy sleeping area can lead to disrupted sleep and difficulty staying asleep.

Reduce screen use before bed
The last thing many people do before going to bed is use their phones. The use of any screen before bed can be disruptive for a variety of reasons. Exposing the brain to high levels of light causes stimulation. The activation of the brain before bedtime causes difficulty falling and staying asleep. Smartphones are designed to keep people engaged and provide information, but this can be harmful to sleep quality. The blue light that emits from smartphones delays the release of melatonin in the brain. It is an artificial color emitting from a screen that activates the brain similarly to how sunlight does. This light causes your brain to be more awake, decreases melatonin release, and leads to restless sleep.
Using a phone right before bed can also lead to increased emotions and racing thoughts. The brain can feel more alert after using social media and this leads to delayed REM sleep. Screen use before sleep is harmful to maintaining consistent sleep cycles and a regulated circadian rhythm.
Some supplements to take
There are many supplements out there that claim to help you fall asleep faster, stay asleep, and have a better night’s rest. Everyone’s body is different and you should find what works best for you to get quality sleep. Melatonin is beneficial to take for occasional episodes of insomnia. It is the main neurotransmitter in the brain responsible for regulating the circadian rhythm. Magnesium is another supplement that has been shown to improve sleep quality, reduce the amount of time it takes someone to fall asleep, and reduce the symptoms of restless leg syndrome. The study that demonstrated this was with a small group of participants. Therefore, more research should be done to determine the benefits of magnesium for sleep quality. Lavender is another supplement that is beneficial for improving sleep quality. It has been shown to induce calming effects and improve sleep quality by causing a sedentary effect.
Medicinal Marijuana as a Potential Method to Treat PTSD
![Best Cannabis Leaf Pictures [HD] | Download Free Images on Unsplash](https://images.unsplash.com/photo-1597266029701-618ac066150a?ixlib=rb-1.2.1&ixid=MnwxMjA3fDB8MHxzZWFyY2h8MXx8Y2FubmFiaXMlMjBsZWFmfGVufDB8fDB8fA%3D%3D&w=1000&q=80)
Our paper for this topic talked a lot about the dysregulation and harm that can come from improperly functioning cannabinoid receptors. But for fun, lets look at one of the ways that cannabis can be used in a medical fashion, specifically PTSD. The two major contributing chemical structures in marijuana are tetrahydrocannabinol (THC) and cannabidiol (CBD). THC is responsible for the euphoric effects of marijuana while CBD is generally considered to be medicinal. CB1 receptors play a large role in our response to fear and anxiety, THC is an agonist for the CB1 receptors on GABAergic nerve terminals which actually helps regulate and prevent fear and anxiety which induces stress. Fear, anxiety, and stress are all important and high in those that suffer from PTSD. Additionally, CB1 activation also impairs the ability to retrieve aversive (negative) memories and blocks nightmares. PTSD is associated with flashbacks, nightmare, and the improper retrieval of aversive memories. This essentially means that marijuana is a very effective method of treating PTSD as a disorder. Additionally, if you give mice (test subjects) marijuana you can prevent PTSD behaviors from ever occurring, meaning that marijuana could be used after a stressful event to prevent PTSD from ever manifesting.
The downside of marijuana in PTSD. Essentially to much THC can actually induce anxiety and psychotic disorders like PTSD. This occurs because marijuana over activates CB1 receptors in glutamatergic rather than GABAergic nerve terminals. This would mean that instead of an influx of inhibitory neurotransmitters, an influx of excitatory neurotransmitters is occurring instead, leading to anxiety and psychotic symptoms. This is especially problematic when you consider the fact that THC concentrations have increased significantly throughout the years. THC in “street marijuana” used to be at 4%, now its more than 15%. Dispensaries sell marijuana with a THC concentration of 22% and people are buying THC concentrate now instead of “normal” marijuana. With increasing THC marijuana might lose its potential to do good instead of bad. It might go from being able to treat PTSD to making PTSD far worse. Researchers are worried that the potential for psychosis and substance abuse might make marijuana a method for treatment that has more concerns and problems than benefits. There is also a potential for the development of comorbidities linked with PTSD, such as depression and anxiety. With improper regulation of THC, CB1 receptors might overstimulate the wrong neurons and lead to a bigger problem than originally was expected. There is also a lot of talk in the provided first reference about the need for increased trials and research on both the positives and negatives of marijuana. It is hard to determine exactly how beneficial something is when it has been an illegal substance for so long and has been limited to studies on lab animals rather than humans due to its illegal nature.
References
Steenkamp, M. M., Blessing, E. M., Galatzer-Levy, I. R., Hollahan, L. C., & Anderson, W. T. (2017). Marijuana and other cannabinoids as a treatment for posttraumatic stress disorder: a literature review. Depression and Anxiety, 34(3), 207–216. https://doi.org/10.1002/da.22596
https://www.drugabuse.gov/publications/research-reports/marijuana/marijuana-addictive
Sleep Stages
Stages of sleep:
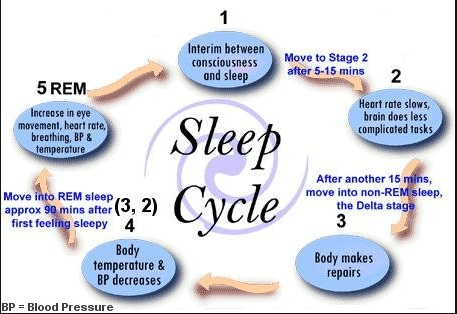
Image to the right: has approximate times for each stage of sleep. Keep in mind that everyone’s sleep stages vary!
Sleep is split into stages throughout the night; there is nREM (non Rapid Eye Movement) which is in four stages and then the REM (Rapid Eye Movement) sleep stage. REM stage of sleep is important for memory consolidation. The stages of nREM are also important for memory consolidation, but also for many other bodily functions.
Stage 1 of nREM: This phase is considered the change from being fully awake to sleeping and only lasts 1 to 7 minutes. Since it’s a very short phase, the main purpose of it is to prepare you for the rest of the sleep stages. Everything slows down, however this stage is easily interrupted if there is too much noise. Since this stage can be disrupted, sometimes you can jerk back awake.
Stage 2 of nREM: This stage of sleep lasts approximately 10 to 25 minutes in the initial cycle and lengthens with each cycle after that. By the end of the night, this stage should constitute between 45 to 55 percent of the total sleep. Someone in stage 2 of sleep requires more intense stimuli than in stage 1 to awaken. In this stage, your heart rate and breathing begin to really slow down. You can see this phase in the brain because the actual wave activity slows down with only a short burst throughout.
Stages 3 and 4 of nREM: These two stages of sleep are referred to as slow-wave sleep. This is called deep sleep, everything is at its slowest and you become very challenging to wake. Stage 3 lasts only a few minutes and constitutes about 3 to 8 percent of sleep. Stage 4 lasts about 20 to 40 minutes in the first cycle and makes up about 10 to 15 percent of total sleep.
REM Stage: During the first cycle of sleep, the REM period lasts only 1 to 5 minutes; however, it becomes more prolonged as the sleep cycles progress. This stage of sleep is the final phase of sleep, where the brain comes to life. This is the phase where dreams occur with all of the brain activity; there is presence of desynchronized (low-voltage, mixed-frequency) brain wave activity, muscle atonia, and bursts of rapid eye movements. The brain begins to function similar to an awake brain, and breathing/heart rate return to waking levels. During this phase many motor muscles are paralyzed. REM cycles start about 90 minutes after stage 1 of sleep.
It is important to get good amounts of both REM and nREM sleep to consolidate memories as well as for overall health in individuals.
Sources:
Institute of Medicine (US) Committee on Sleep Medicine and Research; Colten HR, Altevogt BM, editors. Sleep Disorders and Sleep Deprivation: An Unmet Public Health Problem. Washington (DC): National Academies Press (US); 2006. 2, Sleep Physiology. Available from: https://www.ncbi.nlm.nih.gov/books/NBK19956/
Final Blog Post
Image 1
It’s finals week everyone, we made it to the end of the semester and are nearing the finish line. Because it’s finals week, and motivation is at an all time low I will be providing you relatable, and hopefully something you’ll find funny throughout the rest of this blog. I hope my efforts make your finals week just a little brighter. The question at hand is “how did this class allow you to integrate and apply the skills and competencies you gained throughout your education at Concordia.” Because as you have already realized after nearly completing this class, did more than simply learn what an action potential was and how ions flow in and out of the cell, huge win. 
Image 2
Let’s start with the Peak project shall we? If we’re being completely honest with ourselves almost none of us like group projects, unless we’re the one being pulled along throughout the entire process. But if we think about it for a minute, Concordia has put our group skills to the test from day one. We’ve had group projects throughout our entire collegiate career, some examples: working on a combined research paper, working on a danio rerio (zebrafish) project, working with those annoying little things in biology class with people who never came to class, etc.

Image 3
Whether we’d like to admit it or not, we’ve been doing group projects this entire time, theoretically this has prepared us for the real world. Because, like class, we will not always get along with our coworkers. We might have an annoying individual in our group, we might have to carry the entire workload and receive no extra credit or praise for doing so, it’s part of life and the real world that awaits us. As Forest Gump would say, “life is like a box of chocolates, you never know what you’re gonna get,” the same goes for coworkers in the real world. Our PEAK project allowed us to see the accumulation of our hard work throughout college, allowing us to see not only how far we’ve come in terms of improving our collaboration skills, but also how much we can still improve in the future after graduation. Not one group would say that the work was equally distributed, that they didn’t have at least one LAZY group member, or that everything went perfectly. And that’s alright, that’s real life and this class has helped us see and deal with that reality. The PEAK project encompasses the last three goals of Concordia’s liberal learning. I’ll paraphrase them but you theoretically all know what they are already; responsible participation in the world, understanding of interdisciplinary connections, and cultivating understanding. I will speak in terms of what my PEAK group accomplished because I don’t know what each of you did just yet.
Image 4; just remember, when you’re explaining the brain to someone who doesn’t know much about it, you can often overwhelm them
During our groups time working with Prairie St. Johns in Fargo, we were able to participate in the world, the real world, and not just some hypothetical setting in a classroom surrounded by sleeping students at 8 a.m. I will be perfectly blunt here, my group had MANY obstacles and challenges when it came to interdisciplinary perspectives and connections. The social work majors did not always see eye to eye with the neurochemistry students, and certainly the same can be said the other way around. But at the end of the day we figured out our differences and managed to deliver 160 meals to the local community, mental health de-stigmatization information, and information about local resources and shelters. We gave 140 of the 160 meals to the local homeless shelters, 5 shelters each received just under 30 meals each, some even got chicken wild rice soup hot out of the pot. And you know what the best part about the entire experience was? It wouldn’t have been possible without the help of all 8 members of the group. Sure not everyone carried their weight equally, but at the end of the day if those that did the bare minimum didn’t even do that much, those that did the most would have had to do even more. The entire experience gave all those who contributed a sense of self-understanding and some perspective in life. Let me explain, when we presented the shelters with the meals that we had prepared they showed us a level of gratefulness that was pure and heartfelt. It was as if we had just given them a new car or a new home, it was a moment that put everything into context and showed us as students that the problems that we face on a daily basis may not be as bad as we originally thought, essentially it gave us perspective. I realized that it is hard to compare my problems as a college student, eating 3 (or more) meals a day, to the hardships of those who live without proper housing. It was a humbling experience. 
Image 5; I mean, this one doesn’t need any explanation, come on
What other skills has this class allowed us to foster? Well for me at least this class allowed me to better understand research papers and scientific writing in general. We as a class probably take this for granted, but hand one of our readings to someone who doesn’t have a background in scientific writings and see just how confused they are by the MAPK pathway. I can promise you this, no matter how confused you are by that gobbly gook, they are 10x more confused. Unlike them you know that if you had to you could figure out every detail of that paper. Whether through additional research, breaking down the paper into individual categories like we do on Wednesdays, or extremely careful and slow reading of every detail in a piece of literature, at the end of the day you have the capacity to figure it out on your own. I unironically showed my dad what I was reading the other day and he damn near had a stroke, give yourself some credit you’ve come a long way. You probably see a piece of literature now and say to yourself, “I could figure that out, it might take me a week (or a semester) but I could do it.” These concepts relate directly to Concordia’s first two goals for liberal learning. Our love of learning has improved, whether you think you can or not you certainly have the capacity to read that paper on the MAPK pathway, and your intellectual capacity has grown significantly. I’m not just talking about this class, sure you picked some things up and honed your skills in new ways, but this class is the accumulation of your entire college experience, it is a way to see just how far you’ve come. 
Image 6; the only thing my neurons can seem to remember come test day
That’s it everyone, that’s my final blog post. One thing I’d like to comment on, I know that my posts can be a little goofy and light hearted, but that’s because I want to explain information effectively but also in a way that entertains the reader. I hope that you can all appreciate that I am trying to make this a good time, not only for me as the writer, but also for you as the reader. It is important that we as “scientists” explain complex information in a way that our audience can understand. I will need to be able to do this in my near future, if I as the doctor cannot explain to my patient what is wrong with them in an effective manner, I am doing my job incorrectly. Thank you all for a great semester, best of luck in your future and ROLL COBBS.
Final Blog Post

Throughout the semester, I had a major increase in learning. I had to utilize many skills that I have developed through the four years of being at Concordia College. I had to not rely on a textbook, which was very different for me in this course. Since it was mostly discussion-based, we had to utilize many of the skills that we gained from previous classes such as public speaking.
The skills and knowledge that I have gained from this course will help me with my future goals. I will be better at verbally articulating what it is that I am thinking. I will have an easier time bringing my knowledge to others as we spent the entire semester sharing our ideas and what could possibly be a solution to the different illnesses we reviewed. Blogging was a weekly task for this course, and I believe it helped me and will help me in the future as I will be able to put together short summaries of what was discussed throughout the week. Blogs can help me as a student and in the future as it allows me to generate dialogues. As students, we often have a difficult time sharing our ideas and having to post a blog weekly gave us good practice at a skill that will be useful later.
Learning at a liberal arts institution is very important to me. The liberal arts education allowed me to learn many different ideas and concepts, as well as allowed me to grow as an individual. Liberal arts education allows students to explore many different issues and ideas in so many different fields and become overall more well-rounded individuals. This allowed us to become much more critical readers, thinkers, and writers. Critical thinking skills are a huge part of what most employers are now looking for in future employees.
If I were to highlight my resume with skills that have improved throughout the semester, I would highlight that my communication skills improved. It was a difficult course, and very heavily filled with discussions. The papers we read were quite difficult, but the most important was to bring in the questions we had in class and communicate them with each other (the students) and the professor. The class improved my communication skills as we could openly ask any questions and discuss the material with each other. The course itself helped me become a better reader and a much better communicator.
Opportunity to BREW
Neurochemistry has allowed me to integrate and apply the skills and competencies I have gained throughout my time at Concordia in the following ways. It caused me to test my knowledge thus far in Neurochemistry and beyond, and contribute, communicate, and deliver it effectively to my peers. While scientists are often able to understand and conceptualize material for themselves, they often lack the ability to communicate it effectively and cohesively to others. This course challenged and tested me in this area, as we were tested on our ability to not only know the science, but also effectively communicate it as well.
Neurochemistry has allowed me to take my love for learning, especially learning neuroscience, and excel in it. The course dove deep in the mechanisms and signaling in many different disorders, and I was able to practice and deepen my love for learning by examining and broadening my scope of understanding around these disorders, which helped me to become even more passionate about the ability to heal or change the signaling mechanisms.
Throughout all of my educational career, I have taken courses all over the “science spectrum.” Courses that include biology, chemistry, neuroscience, morality, ethics, math, etc. All of these courses feel combined and put to the test in Neurochemistry. All of these different types of courses matter when it comes to neurochemistry and background in all of them was very important. This knowledge allowed me to have a firm foundation in my education as a whole, and transfer this knowledge into the Neurochemistry course.
The course itself integrates all areas of learning. Educationally, personally, and professionally, by testing your knowledge and ability to apply that to a classroom setting, and in the community as well. This integration is important for “BREWing” as it allows a student to take the skills and knowledge they have learned and apply it in the real world. I think the course was a set and up and reflective of this very idea, as it allows the students to engage with others and share their insight and knowledge, as well as personal experiences with the class. This was great to see as we all have different backgrounds and insights to offer, and we can all learn something from one another through sharing and collaborating together. Since the course was based on discussion and communicating the science, this is a perfect example of the skills that can be applied to real world situations when we as students BREW. We will need to effectively communicate and collaborate with others about the science, about our own experiences and perspectives as well as justify and reason, which the course design allowed for. Overall, the Neurochemistry course allowed me to grow in my knowledge of science, and ability to effectively communicate this knowledge with others.
BREWing at Concordia: Liberal Learning
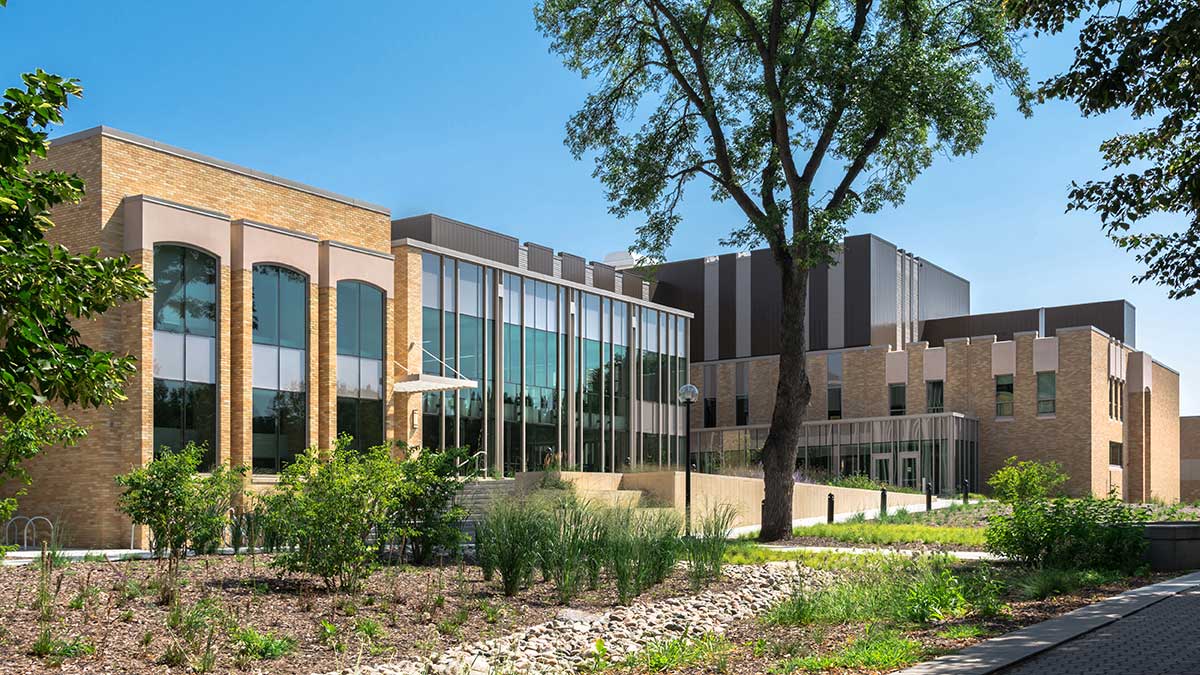
Figure 1: The Integrated Science Center of Concordia college.
Integrated learning at Concordia College
To me, learning at a liberal arts college is meant to produce well rounded individuals that are as prepared as possible to take on the problems of the world as possible. Through this, a variety of classes and disciplines are required to be taken by students to ensure they are exposed to different studies, ideas, and careers. But why should a chemist have to take religion classes? Or a theatre major having to a lab science class? Despite the two examples mentioned above seeming very opposite at face value, they are more interconnected than many think. This is shown through a quote from Thucydides, who was perhaps the most important historian of ancient times as he accounted for the nearly three-decades long conflict between ancient Sparta and Athens as well as the war between ancient Greece and Persia:
“The society that separates its scholars from its warriors will have its thinking done by cowards and its fighting by fools.”
This quote shows in dramatic fashion the importance of interdisciplinary study. But take a prelaw major for example. How could we expect a future environmental lawyer to be effective if they’ve never been in a biology class? So, while liberal learning might not always be the most clear to students being required to take the classes, there is a deeper connection between different disciplines.

Figure 2: A man clearly confused by the problem ahead of him.
How my resume improved
College is all about building the skills necessary to be successful in the future, whether that be in life or through a career. This semester, perhaps more than any other, had me looking like the poor guy in Figure 2. Between this Neurochemistry class and Physical Chemistry there were countless times where I simply had no idea how to answer the question at hand, whether it be derive the Maxwell relations or determine what is causing an increase in prevalence of PTSD and other stress related disorders in women compared to men. But, it was through questions like these that I really developed my ability to problem solve. Of course everyone is going to put that they work well independently and are a good problem solver on their resume, but what if your problem has infinitely many wrong answers, but also an answer that isn’t necessarily right or solvable?
I think that is the kind of problem solving I found myself really developing this semester, especially with the way the exams were designed. By not having the paper and only some of the data coming from it, we as students had to use our prior knowledge of signaling pathways to derive a viable cause for the data we were given. During both of these exams, I found myself reading through all the given information and then just thinking ‘I have no idea what’s going on.’ But I just kept piecing together the things I did know with what was given and soon enough I had a pretty decent guess at what was happening in the article.
What the future holds
The skills learned in this class as well as the ones I’ve developed during my Concordia career, I believed have given me a solid foundation to work off in the future. As I mentioned earlier, this class really helped me problem solve through situations that don’t have a clear answer. I think this will be very helpful as I am planning to attend graduate school next fall. In that environment, I will be working through problems that don’t have an answer yet. With that, I will need to be able to effectively communicate my ideas and findings to other people. While blogging is a fairly casual way of doing that, the skill still helps me be able to communicate with other effectively. And because of these reasons I believe that this class as well as Concordia College’s liberal learning program has helped to prepare me to be successful in the future.
Final Blog Post
I had expectations of this course before taking it but was surprised in the end. My expectations of this course included having lectures, exams, and quizzes similar to the other courses I have taken. The format of this class was a new experience for me and I was hesitant at the start of the semester about how it would go. I was pleasantly surprised about how much I enjoyed and learned throughout this class. The process of learning was very independent during neurochemistry. I learned more skills related to finding information on my own and communicating it to classmates. The topics we discussed required researching them independently and then teaching them to other students. I acquired new skills about how to communicate information efficiently and effectively.
The skills I learned in this class will greatly benefit me in my future career. I plan to work for a few years and then apply to medical school. Learning how to conduct independent research, properly read research articles, and successfully communicate knowledge to others are all skills I expanded on throughout neurochemistry. These are all necessary skills to be successful in any career, especially in the field of medicine. I believe my 2.5 years at a liberal arts college have helped me realize the capabilities I have. There have been many opportunities for me to learn about the topics I want to and teach others about them. Attending a liberal arts college, to me, means providing students with a well-rounded education and preparing them for life after college.
If I were to highlight my resume with skills that I improved upon this semester, I would choose to discuss how I have gotten better at reading and understanding research articles. There are an endless number of topics to read articles about, but how you read them is important. It is difficult to understand all topics within a paper if you do not have any previous knowledge of the research being discussed. Neurochemistry has helped me to start reading every paper with an open mind and knowledge that I will not understand everything after reading it one time. It is important to note questions and the need for clarification when reading an article. I enjoyed this class because I was able to openly ask questions and talk about things I did not understand. This course helped me to effectively read research articles and build communication skills when discussing the article.
I was able to integrate a lot of information from previous courses into this class. I have taken a variety of biology, chemistry, neuroscience, and psychology courses that provided relevant information for neurochemistry. Previous courses have focused on different skills such as exam taking, dissections, and working in a laboratory. All things I learned in the past were applicable to different weeks of content during neurochemistry. I felt I had a greater understanding of topics such as mental illness, anxiety, and sleep because of my previous courses in psychology and neuroscience. It was interesting to learn more about topics I did not know much about such as autism, obesity, and endocannabinoids. Overall, I enjoyed this course and how I was able to integrate old skills into expanding upon new ones.